ZeroBrane Studio Setup
ZeroBrane Studio / Vectric Setup A guide on how to obtain and setting up ZeroBrane Studio on your PC to work with Vectric (Aspire/VCarve Pro).
Download Software
Download ZeroBrane Studio from the ZeroBrane Studio website | Download Page
- Install the ZeroBrane Studio on your PC.
Read Documentation
Review the documentation page | Here
Review the short and simple overview | Here
The MUST READ section is the Debugging: | Here
Copy a File
This action is a Copy Only so DO NOT MOVE:
Copy the mobdebug.lua
file 'From:; C:\Program Files\ZeroBrains\lualibs\mobdebug
If you are running Aspire, copy To C:\Program Files\Aspire V??\Lua\
If you are running VCarve Pro, copy To C:\Program Files\VCarve Pro V??\Lua\
If you are running CUT2D Pro, copy To C:\Program Files\CUT2D V??\Lua\

Install Seed Gadget
Open Aspire/VCarve Pro, using the Gadgets
pull-down menu, select Install New Gadget
and select the SeedGadget_006.vgadget.
Download [| Gadget Seed File]
Set Gadget Project
Open the ZeroBrane Studio, and locate and open the SeedGadget_006.lua file in your Gadget directory: (for example: C:\Users\Public\Documents\Vectric Files\Gadgets\VCarve Pro V??\)
Set your Project location, navigate to the pull down menu, Project
then Project Directory
and select Set From Current File
Edit Seed Gadget
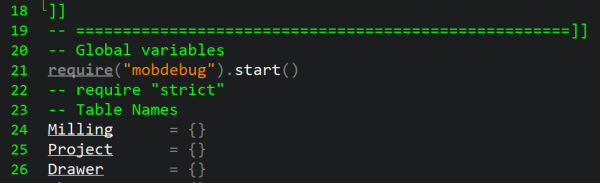
To enable the ZeroBrane Studio for debugging, you will need edit the gadget main header
There are two modes Run and Debug Mode. these modes are set by the require function that loads the library
- require("mobdebug").start() is the debug library
- require("mobdebug").start() is the run library
Standard Run Mode: All gadgets use the require "strict" operator in Run Mode (see image below)

Setup for Debugging: If you are Debugging the Gadget you will need to make the require("mobdebug").start() active (see image below)
Starting The Debugger
To start the Debugger Server, navigate the pull down menu, Project
the and select Start Debugger Server
Debugging The Code
Open Aspire/VCarve Pro and run the SeedGadget_006 gadget.
Switch/toggle from Aspire/VCarve Pro, back to ZeroBrane Studio and begin using F10 key
to step into the code.
Observe the green triangle indicating what line is about to be executed.
You will need to be able to Switch/toggle back and from Aspire/VCarve Pro and ZeroBrane Studio when one application needs interaction (next step, dialogue selection, etc.)
Please refer to the MUST READ section above, to toggle on/off breakpoints, watchlist, bookmarks and a host of other powerful debugging tools within the ZeroBrane Studio.